.png) NEER INTERACTIVES
NEER INTERACTIVESPrices are not determined by a central authority, but rather are the result of buyers and sellers interacting in markets. The buyers and sellers have to all not been in the same place, they just have to be looking to conduct the same economic transaction. Market prices and production quantities are determined by the supply and demand model with Buyers' preferences comprising the demand side and sellers' preferences comprising the supply side of the market.
Prices and quantities are then determined by the point where supply and demand come together, thus the evaluation confirms that prices and quantities are the outputs of the supply and demand model, not the inputs. Leveraging the big data in supply chain functions to improvise on business profitability as well to enhance operational efficiencies and reduce costs.
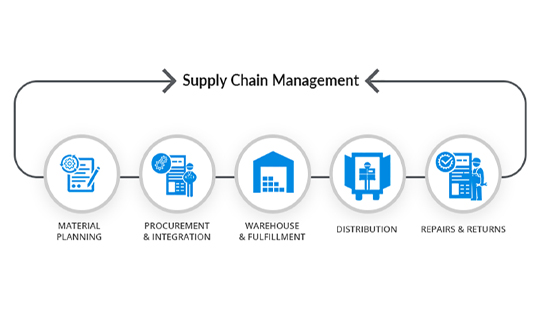
Supply chain management (SCM) is the management of a network of interconnected businesses involved in the ultimate provision of product and service packages required by end customers. It spans all movement and storage of raw materials, work-in-process inventory, and finished goods from the point- of- origin to point-of consumption.
NISL product suite - Agriculture DS Manager (Demand Supply Manager) is a web application that works on data mining and GIS to enlist and elevate the channel of demand on Maps. The program is the first of its kind in Agriculture that works as an index of hot spots and likely hot spots, hot dots, hot products to plan accordingly.
DS Manager works as a data mining intelligence to analyze the pockets (clusters) from the previous year(s) to plan for the future roadmap in identifying the demand, organizing supply, tracking distribution and monitoring the sales. It also comes with a geo-tagged verification (GIS Eye) to verify the quality at the field level.
DS Manager works as a data mining intelligence to analyze the pockets (clusters) from the previous year(s) to plan for the future
roadmap in identifying the demand, organizing supply, tracking distribution and monitoring the sales. It also comes with a geo-tagged
verification (GIS Eye) to verify the quality at the field level.
Agri- DS Manager fits on all data repositories of the (already) existing systems and will be connected to the backend / UI based on
the site specifications.
Some of the Tricky challenges addressed by DS Manager are
Is your organization following the patterns in the customer behavior in order to plan your marketing and routes of sales? -To help improve business effectively.
Have you worked out the reasons behind Customers Dropouts / Drop in Sales? And their distribution on ground (map) is not a uniform distribution on spatial density? -To reduce the loss in operations by qualitative analysis.
Is addressed of logistics in your firm worked-out using Customer base analysis, Cost of Customer Acquisition, Transportation, Marketing Cost?- To help the situation analysis- Vision oriented organizations work with Marketing Efficiency Models.
Is your organization working in High-Risk Zones / Groups - the places where the chances of damage are more and vigilance angle is required? - Data plays a major role in taking a decision and accommodating the customer accordingly. Data wrt. Seasons, fertilizers, process has to available in one base - GIS to address this challenge, like in DS Manager.
If your organization is also working on these lines, you are on the right track. Neer Interactives - Agri DS Manager is the solution to challenges in Marketing, Sales, Production, and Quality Control, Customer Analysis in a user friendly application to help better business operations.
The organization works as an agriculture service provider of Information Systems,logistics in all the stages of farming so as to achieve improvement in the agriculture practices followed by the Supply Chain Management to help the upliftment of our clientele that includes Government, Corporations, Cooperative Societies, farmers, etc.
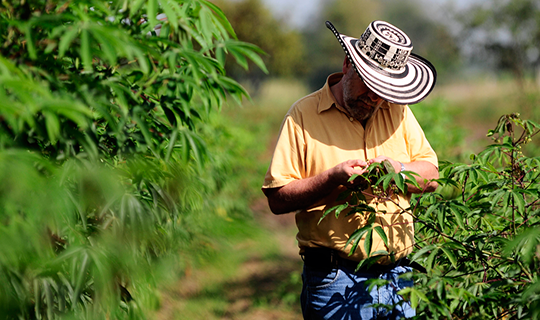
Agriculture, the major sustenance base for the human survival has a significant history in India. The Agriculture sector with its grand mark ranks at the second place in the worldwide with respect to the farm output. Some of the critical challenges in this sector are due to lack of information, analysis with respect to the risk associated to the crop, season, land (soil), rainfall, groundwater, irrigation facilities besides the support of the respective administration.
In the major extent as aforesaid, the primary risk is to the wholesales, banking firms; Commodity Traders as the stock accumulated
is at huge levels and may turn into huge losses without a notice. However, the risk will also touch the associated farmers who have no clue on the appropriate key to the price, place, product, period (time to sell), because of no / lack of proper information on time.
This adverse situation can be addressed with Neer Interactives AMRA, a powerful market research analysis solution with risk prediction. AMRA stands for Agriculture Marketing Research Analyst, built on Data mining techniques combined with supply chain management and Geographical Information System (GIS) -Spatial Analysis versed with a patented principle of agriculture economics.
AMRA is a web based product envisioned with intelligence & analysis to support the agriculture producers (farmers) in price, demand, time determination for the commodity produced. This model also identifies the markets, products with demand in advance besides helping the policy makers (advisors) in the quality analysis of the supply chain from time to time.
Some of the significant features of the AMRA are
A.Farmer / Commodity / Customer / Crop mapping
B.Hot Spots - (AMC, yards based on crop, market fee, Revenue Made)
C.Market Profit Intelligence Indicator
D.Journey to Sale (of commodity / Stock)
E.Route map based report (the path travelled by the stock), Trader Route map
AMRA, Agriculture Marketing Research Analyst works as a platform to make decisions in the commodity regions that are influenced by multi parameters like place, price, promotion, period (time) and product. The software comes with an analytical intelligence clubbed with the rational theory of choice making it more optimum to guide the decision maker. The Market intelligence/surveys information can also be integrated in order to compare in the intra-inter and Extra- Markets and market spaces.

In the proposed system, Handling the operations are very easy on day to day basis and system more transparent about the plantation and yield by enabling GIS(Global Information System) in the portal to track down the data statistics more precise. By using PIS, Officials can easily access required data based on the authority of access to strict protocols and validations of database restrictions. To make the system more secure, enabling logins with their authentication levels which pre-placed. Frequent update of data on a daily basis.
About IPIS: Neer Interactive Solutions provides software solutions for exactitude agriculture and plantation management. The importance of the agriculture and plantation sector in the country is increasing as the demand for raw materials is rising and the supply from the natural forests is dwindling. Neer has been developing management information systems and Geographic Information Systems, customized database applications and specialized concept based software with major thrust on Data Analytics and Business Intelligence to improve and help organizations in effective decision support systems.
As part of many of its initiatives Neer has been helping the State Governments to build effective and robust data driven system. Integrated Plantation Information System (IPIS) is one of the highly appreciated systems for automating and computerizing of huge manual process in a very effective and highly responsive system with state of technology.
The software was developed to provide improved management tools to our customer to increase visibility into operation, Enhance control, provide complete support and high end Business Analytics model in improving the productivity and thus reduce costs.
The software works as an end to end solution for the Forest Development Corporation plantations right from the planting to harvesting stage. This system provides both MIS and GIS based reports to the department for improving the performance, productivity and cost management.
Some of the major modules of the IPIS are
1. Web Portal
2. Plantation Estimation Manager
3. Plantation Information System
4. Finance Module linked to plantation cost
5. Plantation Geo Tagging using Google Maps
6. Production Management System
7. Sales Management System
8. Human Resource Management System
9. Infrastructure Management System
10.Document Management System
Agriculture, the major sustenance base for the human survival has a significant history in India. The Agriculture sector with its grand mark ranks second worldwide in farm output. This industry was also a major contributor to GDP valuing 18.6% of the GDP in 2005 has debasing declined and worsened to 13.7 for FY 2013.
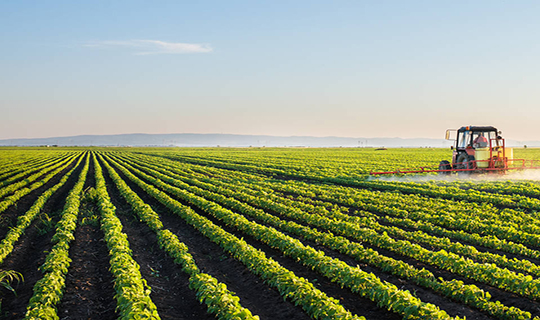
The critical challenge in this sector is mainly due to lack of supply chain management and market analysis resulting in ambiguity in pricing of the commodities and market opportunities (price, market, and time determination), etc. The other challenges include poor connectivity to rural areas, exploitation with fake (adulterated) fertilizers and pesticides, inadequate infrastructure, credit and storage facilities, etc.
This adverse situation can be addressed with Neer Interactives AMRA, a powerful marketing research analysis solution. AMRA stands for Agriculture Marketing Research Analyst, built on Data mining techniques combined with supply chain management and Geographical Information System (GIS) -Spatial Analysis versed with a patented principle of agriculture economics.
AMRA is a web based product envisioned with intelligence & analysis to support the agriculture producers (farmers) in price, demand, time determination for the commodity produced. This model also identifies the markets, products with demand in advance besides helping the policy makers (advisors) in the quality analysis of the supply chain from time to time.
Some of the significant features of the AMRA are
A.Commodity mapping Locating the Commodity areas on the given map.
B.Hot Spots (AMC, yards based on crop, market fee mapped).
C.Farmers Profit Intelligence Indicator (FPII) with quantity, price, month and commodity basis.
(This indicator will help and guide farmer to the best sale to sell his produce at right place and right time).
D.Hot Spots extended onto commodity, temporary markets, market fee mapped, etc.
E.Journey to Sale (of commodity) Route map based report, Trader Route map - to help in identifying the markets and products on demand.